Home »
Characterization of pyrocarbons : structure and texture
There are many techniques for the characterization of pyrocarbons, which are complementary to each other.
Polarized Light Optical Microscopy (PLOM) is the most traditional technique. It is performed on a deposit made on a fiber, viewed perpendicularly to the fiber axis: this gives a “Maltese Cross” pattern between crossed polars. Two pieces of information are obtained:
- The Extinction Angle (Ae) such that the Maltese cross switches off. The higher it is, the more anisotropic the carbon is;
- The Maltese cross border morphology, which gave origin to the “traditional” denominations (Rough, Smooth).
X-ray Diffraction (XRD) enables the evaluation of the anisotropy degree through several indicators : presence or not of 101 and mainly 112 peaks, characteristic of the graphitic crystalline order (as opposed to turbostratic order, with lower dimensionality, for which only exist asymmetrical bands 10 and 11 in addition to the 00l reflections), value of the interlayer distance d002 (Å), which is always larger in the turbostratic carbon than in crystalline graphite, 002 peak width, which translates the space extension of the structurally perfect domains (“coherent domains” as viewed by XRD), etc …
The Raman spectroscopy gives a wealth of information on carbons. Two main bands are obtained : the G (Graphitic) band and the D (Defect-induced) band, the latter being absent in ideal graphite. several quantities are of interest :
- The band widths at half-maximum (e.g. for the D band FWHMD), which indicates the amount of small-size defects ;
- The anisotropy ratio RA between the band heights without and with an polar analyzer filter, which informs about the large-size texturation of the material (as well as Ae in PLOM) ;
- The intensity ration between G and D bands, which quantifies the defect amount.
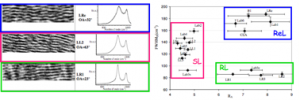
The Transmission Electronic Microspcopy (TEM) characterizes pyrocarbons in several ways. In Dark Field (DF) 002 mode, it is possible to light up or down selectively the coherent domains with normals oriented along a chosen direction inside the projection plane ; this allows a quantification of the anisotropy by quantitative comparison of two images obtained by choosing two perpendicular directions.
Using the Lattice Fringe (LF) mode in High-Resolution TEM (HRTEM) one gets a visualization of the material nanotexture ; a Fourier transform analysis allows quantifying the statistical disorder of the orientations inside anisotropic domains, by recording the angular opening (AO, in °) of the 002 arcs (associated to the (001) planes)
Still in TEM, the Selected Area Electron Diffraction (SAED) gives access to a quantitative assessment of the material anisotropy on a charcteristic size of several micrometers: the angular opening (AO, in °) of the 002 arcs (associated to the (001) planes), exactly as for the Fourier transform of the HRTEM-LF images, but on a larger area.
Our teams have a long experience in pyrocarbon characterization. We have developed quantitative analysis tools (SAED, HRTEM-DF anisotropy, FFT of HRTEM-LF images, etc …) and we have designed the “IGAR” method.
Ce message est également disponible en : French


